
The first time park factors saved me money
Coors Field, late August, two starters with sub-3.50 ERAs facing each other. The total was sitting at 9.0. I almost backed the under because the pitching matchup looked clean. Something stopped me – the multi-year Coors park factor was screaming at me, and I’d just learned (the hard way) that altitude in Denver doesn’t care about ERA. I passed. The game went 12-7. The under tickets were dust by the fourth inning.
Park factors are the most consistently underweighted variable in casual MLB betting. The data exists, it’s stable, and yet the market still misprices games where the park’s effect dominates the matchup. Below is how I read park factors, where the meaningful effects live, and the traps to avoid.
What a park factor actually measures
A park factor is a multiplier expressing how much a venue inflates or suppresses a particular outcome relative to the league average. The headline park factor is for runs scored. A park factor of 1.10 means runs are scored 10% more frequently at that venue than at a neutral park; 0.92 means 8% fewer runs.
The math is simple, but the inputs need care. A reliable park factor is built from at least three seasons of data, and it splits home and away splits to remove the bias of a particular team’s offensive profile. A park’s “true” factor is the run rate at the venue divided by the run rate of the same teams at all other venues – which controls for which clubs played there.
Park factors split by handedness reveal more than the headline. Yankee Stadium’s overall HR park factor is roughly 1.05 – modestly hitter-friendly. But its left-handed-batter HR park factor sits closer to 1.20, while the right-handed-batter factor is roughly 0.95. The headline number washes out the asymmetry. A serious bettor reads handedness-split factors, not headlines.
The 2024 MLB regular season drew 71.3 million fans – the largest in seven years – and MLB.TV streaming hit 14.5 billion minutes watched. With that data volume, every park’s run-allowed and home-run-allowed numbers update in near-real-time, and the multi-year factors stabilise quickly into reliable signal.
The hitter-friendly stadiums that move lines
Coors Field in Denver is the canonical extreme. Altitude reduces air density, which reduces drag on the baseball – meaning balls travel further once put in play. The park-factor multipliers at Coors run roughly 1.25-1.30 for runs and 1.20-1.25 for home runs across multi-year samples. That’s one of the largest park effects in any major sport, anywhere.
The humidor was supposed to neutralise some of the altitude effect by storing baseballs in controlled humidity that keeps the leather and yarn behaviour consistent. It helped at the margins. It did not eliminate the altitude effect. Coors plays as the most hitter-friendly park in MLB by significant margin, full stop.
| Park | Run park factor (3-yr) | HR park factor (3-yr) | Notes |
|---|---|---|---|
| Coors Field (COL) | ~1.27 | ~1.22 | Altitude effect dominant |
| Great American Ball Park (CIN) | ~1.10 | ~1.18 | Short power alleys |
| Yankee Stadium (NYY) | ~1.05 | ~1.10 | Strongly LH-skewed |
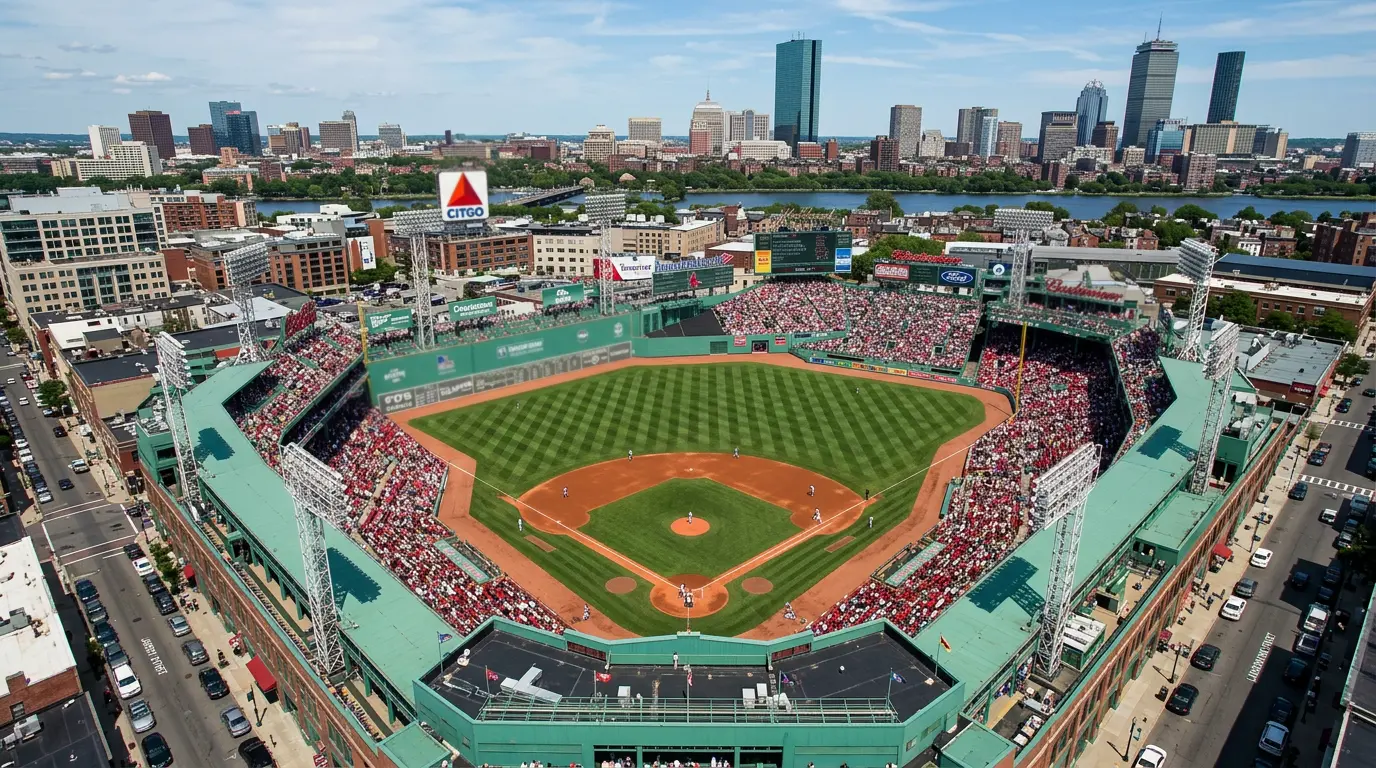
| Fenway Park (BOS) | ~1.06 | ~0.99 | Doubles park, not HR |
| Wrigley Field (CHC) | ~1.03 | ~1.05 | Wind-dependent |
Wrigley deserves a footnote. Its park factor is wind-dependent in ways that other parks aren’t. With the wind blowing out, Wrigley plays as an extreme hitter’s park (factor north of 1.20). With the wind blowing in, it plays as a pitcher’s park (factor below 0.90). The annual average smooths to roughly 1.03, but no individual game plays at the average.
Approximately 4.31% of UK accounts get restricted by operators over a twelve-month period for commercial reasons, and consistent winning on park-factor-driven totals plays is one of the patterns that draws scrutiny. Spread your volume rather than concentrating it at a single book.
Pitcher-friendly parks
The other end of the distribution is just as important. Pitcher-friendly parks suppress runs, suppress home runs, and reward pitchers with marginal stuff. Backing unders at extreme pitcher’s parks is one of the most consistent strategies in baseball totals betting.
The headlines: Oracle Park in San Francisco, Petco Park in San Diego (since renovations), T-Mobile Park in Seattle, and Comerica Park in Detroit. All four play with run park factors below 0.95 and HR park factors below 0.92 across multi-year samples. Marine layer at Oracle, deep dimensions at Petco and T-Mobile, and cold weather plus large foul territory at Comerica all combine.
What’s less obvious: the pitcher-friendliness compounds with the home pitching staff’s profile. Teams that play in pitcher-friendly parks tend to develop pitchers whose styles fit the park – flyball-heavy starters who’d be exposed in Denver or Cincinnati but thrive at Oracle or T-Mobile. So the matchup edge isn’t just the park; it’s the park-staff combination.
Applying park factor to totals projection
How I actually use park factors in totals analysis: I take the projected total based on starter quality alone, multiply by the home park’s run factor, and that’s my baseline. Then I adjust for weather, umpire and lineup splits. The park factor is the foundation; the other variables are the modifiers.
Worked example. Two starters projecting to a neutral-park total of 8.5 runs. The game is at Coors with a run park factor of 1.27. My adjusted projection is 8.5 × 1.27 = 10.8 runs. If the book has the line at 9.5, that’s a sizeable gap and the over has clear value. If the book has the line at 11.0, the gap reverses and the under starts looking interesting.
The same calculation for a game at Oracle Park with a run park factor of 0.93. The 8.5 neutral total adjusts to 7.9. A book listing the total at 8.0 is showing a line aligned with the projection – pass. A book listing the total at 8.5 is showing a line where the under has value, because the projection is below the line.
One important nuance: park factors are about averages over many games. A single game’s actual outcome doesn’t have to match the park factor – variance is enormous. The point of using park factors is to bias your projection in the direction the park reliably leans, not to predict any specific game. Over hundreds of bets, the bias compounds into edge.
Pitfalls of single-season data
Single-season park factors are statistical noise dressed up as signal. The variance from one season to another at any park is large enough that a 1.05 factor in 2024 could be 0.97 in 2026 with no underlying change to the park. Don’t trust single-season figures.
The minimum sample I use: three seasons of data, weighted slightly toward the most recent year. Five-year samples are even better but become less responsive to genuine park changes (renovations, dimensional adjustments, ball composition). The Cincinnati-style adjustments to Great American – fence movements, outfield reconfiguration – invalidate older data and require a re-baselining of the park factor going forward.
The other pitfall: don’t use raw run totals as a proxy for park factor. A park where the home team has been bad for three seasons will show artificially high run totals (because the home pitchers are bad) and an artificially low away-side run total (because road clubs benefit from facing those bad pitchers). The true park factor controls for those team-quality biases by comparing the same teams’ run rates at the venue versus elsewhere.
For more on the wind component that distorts park factors at certain venues – particularly Wrigley – my breakdown of how MLB totals strategy reads wind, umpires and lineup splits covers the daily variables that overlay the static park-factor baseline.
Why is Coors Field's park factor abnormally high even after the humidor?
How many seasons of data does a stable park factor require?
Material created by the team DIAMONDLINE