The market that taught me patience
For a long time, home-run props were where I lost the most money. The reason wasn’t the picks – it was the pacing. I’d take an HR prop nightly because the long odds felt enticing, and the variance ate me alive. The break came when I started treating home-run markets the way I treated futures: low frequency, deep research, decisive sizing only when the model and the line genuinely diverged. The hit rate didn’t change much. The bankroll graph completely changed.
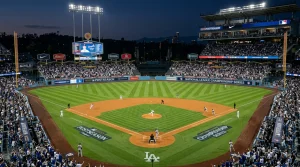
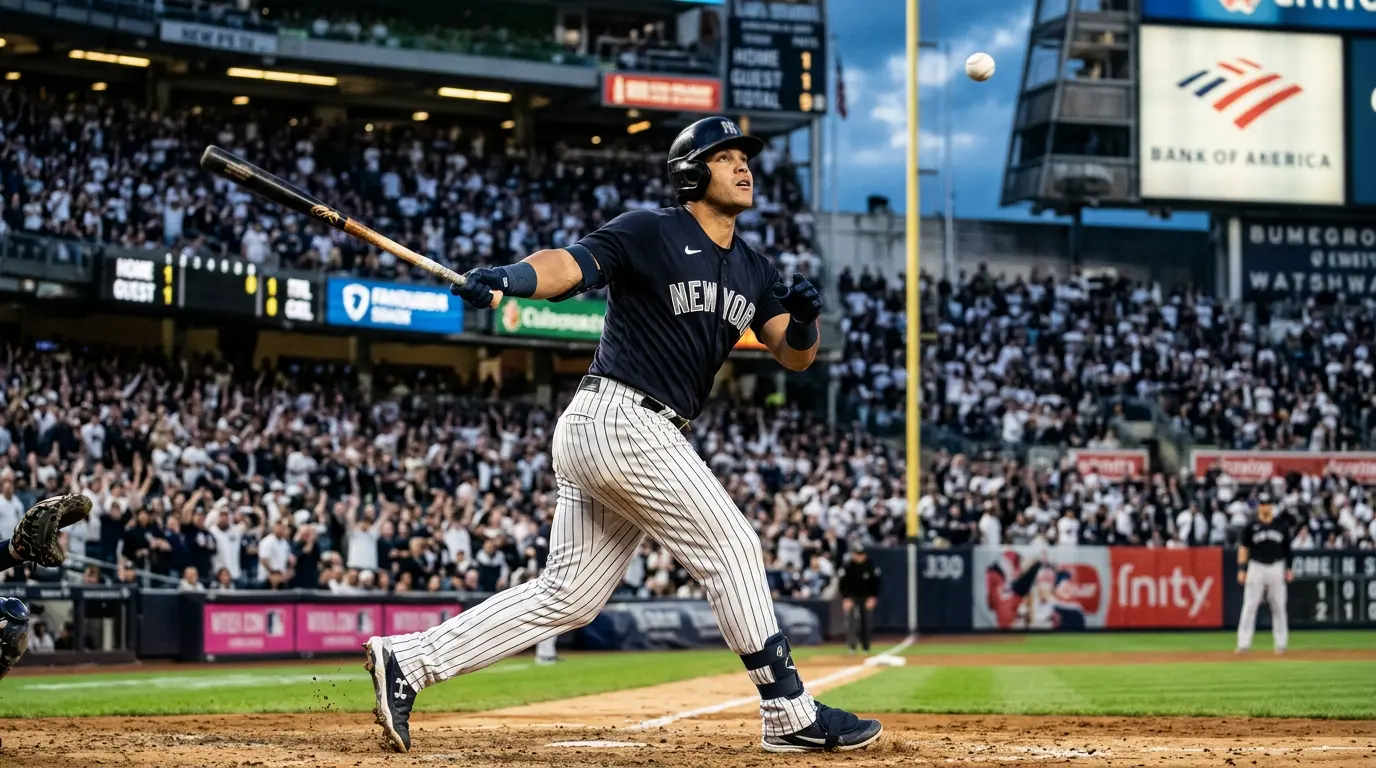
Home-run props are the longest-odds player market on the MLB menu, and they’re priced with the highest book margin precisely because the public loves them. Every casual punter dreams of the seventeen-to-one home-run scorer that lands. The books know this and protect themselves accordingly. Bryant Simon at Temple University put it well when describing the 2024 World Series matchup of Dodgers and Yankees as “two storied franchises from the two biggest cities in the country, with real star power on each team” – that star power is what drives the volume on home-run props for marquee hitters, and it’s what drives the inflated juice the books charge.
Home run prop formats – what’s actually listed
The cleanest format is “Player to hit a home run” – a binary yes/no settled at end of game. UK-licensed books typically price this between 5/2 and 6/1 for everyday starters, and out to 12/1 or longer for low-power profiles. The implied probabilities translate roughly to 13-30% for the offered range, and the natural rate is somewhere south of those numbers depending on the hitter, the park, the pitcher and the weather.
“Player to hit two or more home runs” is the multi-jack market – payouts often around 16/1 to 25/1 for stars, longer for everybody else. This is the market that ate me alive in my early years because it looks like value. It almost never is. The base rate for any individual hitter going deep twice in a single game is roughly 1-2% across the league, and the books price it at 4-6% implied probability. The juice is brutal.
“First home run scorer” markets – which player will hit the first homer of the game – are the lottery-ticket end of the menu. Liquidity is thin, prices are speculative, and the variance is enormous. Read these as entertainment, not as core staking opportunities.
“Either team to hit a home run” and team home-run totals at over/under 1.5 or 2.5 are game-level prop variants. Different research process, different pricing dynamics. The team-total over of 1.5 home runs is one of the more reliably mispriced markets when matched against an extreme park-pitcher combination.
The power metrics that actually matter
Surface power stats – career home runs, season home runs, slugging percentage – are starting points that the books have already priced. The metrics that actually drive home-run probability projections are isolated power, barrel rate, exit velocity and launch angle.
Isolated power, ISO, is slugging minus batting average. It strips out the singles and tells you what fraction of a hitter’s hits are extra-base damage. An ISO above .250 is elite power territory; .200 is solid; below .150 is below-average power. The 2024 NL MVP season from Shohei Ohtani – .310 average, 54 home runs, 130 RBI, 134 runs, 59 stolen bases, 1.093 OPS, 9.1 fWAR – sat with an ISO comfortably north of .300, which is why his home-run prop lines stayed relatively stable across the season despite the public-money tax. The numbers backed the price.
Barrel rate is the modern Statcast metric that actually predicts home runs going forward. A “barrel” is contact made with the right combination of exit velocity and launch angle to produce extra-base damage at high probability. Hitters with barrel rates above 12% are home-run threats every plate appearance; below 6% and you’re staking on small-sample variance regardless of what the season HR total looks like.
Exit velocity on its own – the speed of the ball off the bat – is necessary but not sufficient. A hard line drive doesn’t help a home-run prop; it has to be a hard fly ball. So launch angle gets weighted alongside exit velocity. The sweet spot is roughly 25-30 degrees of launch with exit velocity above 100 mph. Hitters whose contact profile centres in that zone are home-run candidates against any pitcher, anywhere.
Park and weather effects – where the line actually sits
The 2024 MLB regular-season attendance hit 71.3 million – the largest in seven years – and MLB.TV streaming reached 14.5 billion minutes watched. That’s a lot of eyeballs on every ballpark, and the data on park-by-park home-run rates is now public, granular, and updated nightly.
The headline parks for inflating home-run prop lines: Coors Field at altitude, Great American Ball Park, Yankee Stadium with its short right-field porch, Wrigley Field when the wind blows out, Progressive Field, and the Cincinnati and Philadelphia bandboxes. Pitcher-friendly parks that suppress home-run lines: Oracle Park in San Francisco, Petco Park in San Diego, T-Mobile Park in Seattle, and Comerica Park in Detroit.
The handedness interaction matters. Yankee Stadium’s right-field porch is short – devastating for left-handed power, less impactful for right-handed bats. Citi Field plays the opposite way: tougher on left-handed pull power than the dimensions suggest because of how the wind funnels off the East River. So the same hitter at the same park has different home-run prop value depending on which side of the plate he hits from.
Weather is the daily variable. Temperature: balls carry better in warm air. A 30-degree-Fahrenheit difference between a 50-degree game and an 80-degree game changes home-run probability noticeably for borderline contact. Wind: a 12 mph tailwind at Wrigley adds detectable carry, especially at the corners. A headwind kills it. Humidity: high humidity reduces carry slightly. The cumulative effect of weather on a single game can shift home-run probability by 15-20% relative to the same matchup in different conditions.
Pitcher handedness and matchup edges
Left-handed power against right-handed pitching is the classic edge – most lefties hit right-handers harder than left-handers because the ball breaks into the swing path rather than away from it. The platoon split shows up in every reliable hitter projection, and the home-run prop lines reflect it, but they sometimes underadjust for the more pronounced splits.
Pitch-mix matters too. Pitchers who throw sinkers and induce ground balls are home-run-suppression specialists almost regardless of velocity. Pitchers who throw fly-ball-prone four-seamers and elevate in the zone are home-run pinatas, especially in hitter-friendly parks on warm nights. A starter with a HR/9 above 1.5 over his last twelve outings is a starter whose opposite hitters’ home-run props you should be looking at.
The reliever angle is underused. Late-game relievers who throw fly-ball-prone heat into eighth-inning leverage spots are home-run risks every appearance. If a hitter’s prop is set assuming standard at-bat distribution but the actual game state pushes that hitter into a third PA against a vulnerable reliever, the realised probability can exceed the implied line by several percentage points.
For a more comprehensive look at how pitching-side metrics shape these matchups, my breakdown of how ERA, WHIP and FIP read together for betting analysis covers the pitcher-side variables that show up first when I’m projecting a hitter’s prop line.
Does a home run scorer bet pay if the player hits two homers?
Which MLB park inflates home-run odds the most for left-handed bats?
Material created by the team DIAMONDLINE